
Less than 10 mins
Did your hotel or restaurant renovation pay off? Measuring design impact: Pre and post renovation KPIs linking design to revenue and reviews
by Norbert Vas, I-AM Group Partner APAC
Interior design still gets called "just a feeling" in hospitality boardrooms, and there is a reason it keeps happening. Nobody names the number the project will be judged on before the first drawings go out. So when the property reopens and the numbers move, or don't move, the designer, the operator and the owner spend six months arguing over what caused what.
The strange thing is that the numbers to settle this argument already exist. Every hotel and restaurant operator who takes the job seriously already tracks them. RevPAR and ADR for hotels. RevPASH and average check for restaurants. Review scores, guest surveys and NPS across both. The evidence under those numbers is now solid enough that if you are still saying "you can't measure design", you haven't been reading. The hard part is picking the number to watch before the building work starts, not measuring it after.
The rest of this piece covers the hotel numbers, the restaurant numbers, the case studies, and where the whole thing gets slippery enough to be honest about.
What design moves in a hotel
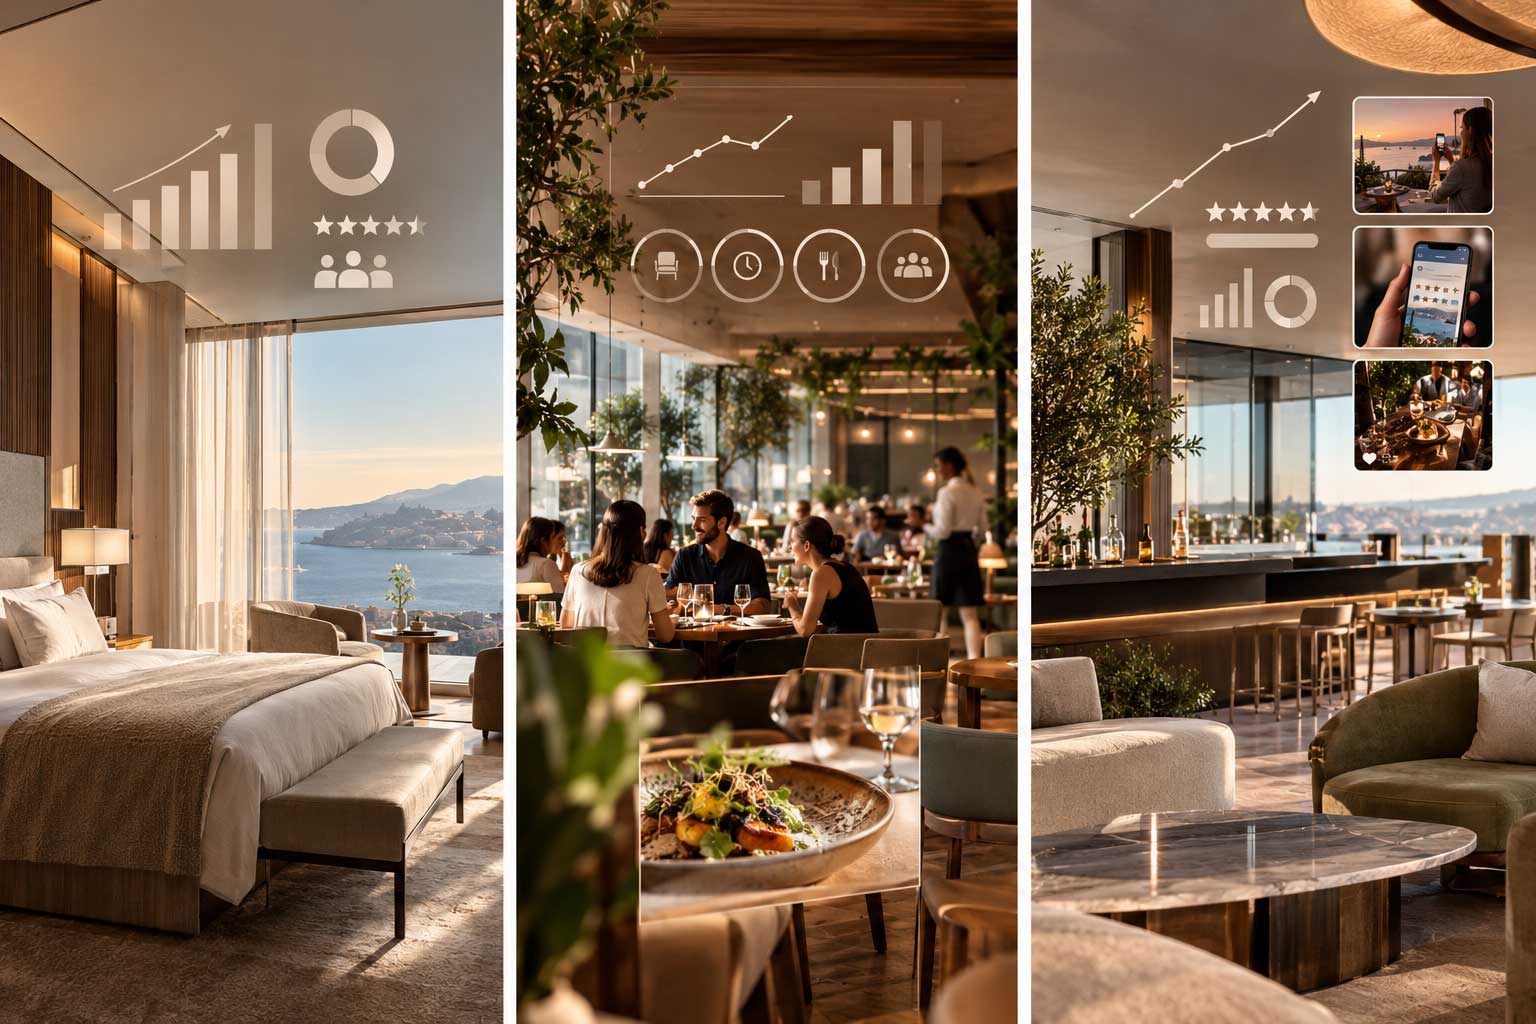
Start with room rate. A normal product refresh lifts ADR by about 8 to 15% and RevPAR by 5 to 15% in the STR and asset-manager benchmarks. If instead of just a refresh you do a soft-brand conversion, or you switch an independent property over to a flagged brand, the RevPAR range opens up to 15 to 30%. That is because you are doing two things at once: changing the design, and changing the way the hotel gets sold to guests.
Review scores are where design pays its most measurable interest. Chris Anderson at Cornell studied review-score behaviour on the OTAs. He found that if a hotel moves up one point on a five-point scale, it can raise room prices by 11.2% without losing bookings. The same data showed that a 1% bump in reputation score is worth about a 0.89% ADR uplift and a 0.54% occupancy uplift. So when a renovation lifts the sub-scores for cleanliness, room condition and common-area comfort, it is buying the ability to charge more. And now there is a known rate at which review-score points turn into price.
To check whether the renovation is actually working, owners look at Occupancy Index against a defined comp set. That is the STR-standard test. Cornell's large-sample work on repositioned hotels found that occupancy caught up with the comp set in about 1.75 years, measured against a rising market. Today's underwriters are more careful. They assume it takes 30 to 36 months for a hotel to reach its steady sales level, and they assume year one
lands at 65 to 75% of that steady number. Either window gives an owner a fair point at which to check whether the renovation is on track.
On the guest side, NPS and J.D. Power's North America Hotel Guest Satisfaction Index sit in every owner's deck. The 2025 NAGSI methodology scores across seven dimensions. Three of them (facilities, guest room and staff service) are things design and operations can directly change. If a property's scores across those three dimensions climb after reopening, and the operations team held up their end, that gives the design work a clear story to defend.
There is a useful 2025 study in the Journal of Hospitality and Tourism Insights by Pillai, Martin and Douglas. They looked at a 248-room luxury hotel in the southeastern US that had renovated its lobby. They combined TripAdvisor guest data with STR financials. They found the renovation produced both a guest-satisfaction bump and a short-term financial gain. The paper's title, "Temporary shine or lasting impact?", warns about a second problem the authors also studied. I come back to that in the last section.
What design moves in a restaurant
Sherri Kimes came up with RevPASH, which stands for revenue per available seat hour, while she was at Cornell. It has outlasted a generation of restaurant analytics products, and for good reason. RevPASH takes three things — seat count, hours of service, and revenue per seat-hour — and packs them into one number. That number changes whenever you change the layout, the table density, the aisle width or the seating mix. If you swap out four-top rounds for a mix of two-tops, banquettes and communal seats, RevPASH will change within one shift.
Table turnover sits under RevPASH. How server pathways run, how well the pass is in view from the table, and how fast a table gets reset all change the time between a guest sitting down and getting up to leave. On a peak Saturday, if you cut five minutes off the average turn, you fit in one more group of diners. That is the difference between a good Saturday and a great one.
Average check is also design-sensitive, though in an indirect way. The way you zone a room — bar seating, booths, communal tables — shapes the group sizes you attract and the orders they place. Lighting is the lever most operators still underuse. Brighter and cooler light pushes diners through the meal faster. Warmer and dimmer light makes them linger and drink more. That pattern has held up across two decades of Cornell hospitality research. If a designer can't tell you which of those two behaviours the operator wants, they haven't talked to the operator yet.
Cover count per shift, repeat visit rate and dwell time round out the operational read. Dwell time at peak service is the clearest sign that the layout has a problem. A slow table off-peak does not really matter. If a table is slow at 8pm on a Saturday, that costs the restaurant real money.
External review scores are one of the clearest numbers where you can see the effect of design, and operators still don't pay enough attention to them. Casual restaurants live and die on their Google composite. When a restaurant's Google score jumps from 4.3 to 4.5 stars, the list of restaurants a diner sees before they even walk to the front door changes. TripAdvisor and Yelp play smaller but real roles in tourist-heavy markets. Instagram and TikTok tagging has quietly become a tracked number at design-forward operators, because every moment a guest wants to photograph is free marketing the operator never paid for.
The evidence in the case studies
Center Hotels in Iceland offers a compelling example of design’s measurable impact on hotel performance. Following a comprehensive rebrand and redesign of its properties, COO Sara Kristófersdóttir reported a 30% uplift in RevPAR. That result reflects more than a refreshed visual identity or improved interiors: it demonstrates how a stronger brand, more distinctive guest experiences and better-designed environments can increase commercial value. When design changes how guests perceive, choose and experience a hotel, the impact shows up where it matters most: in revenue.
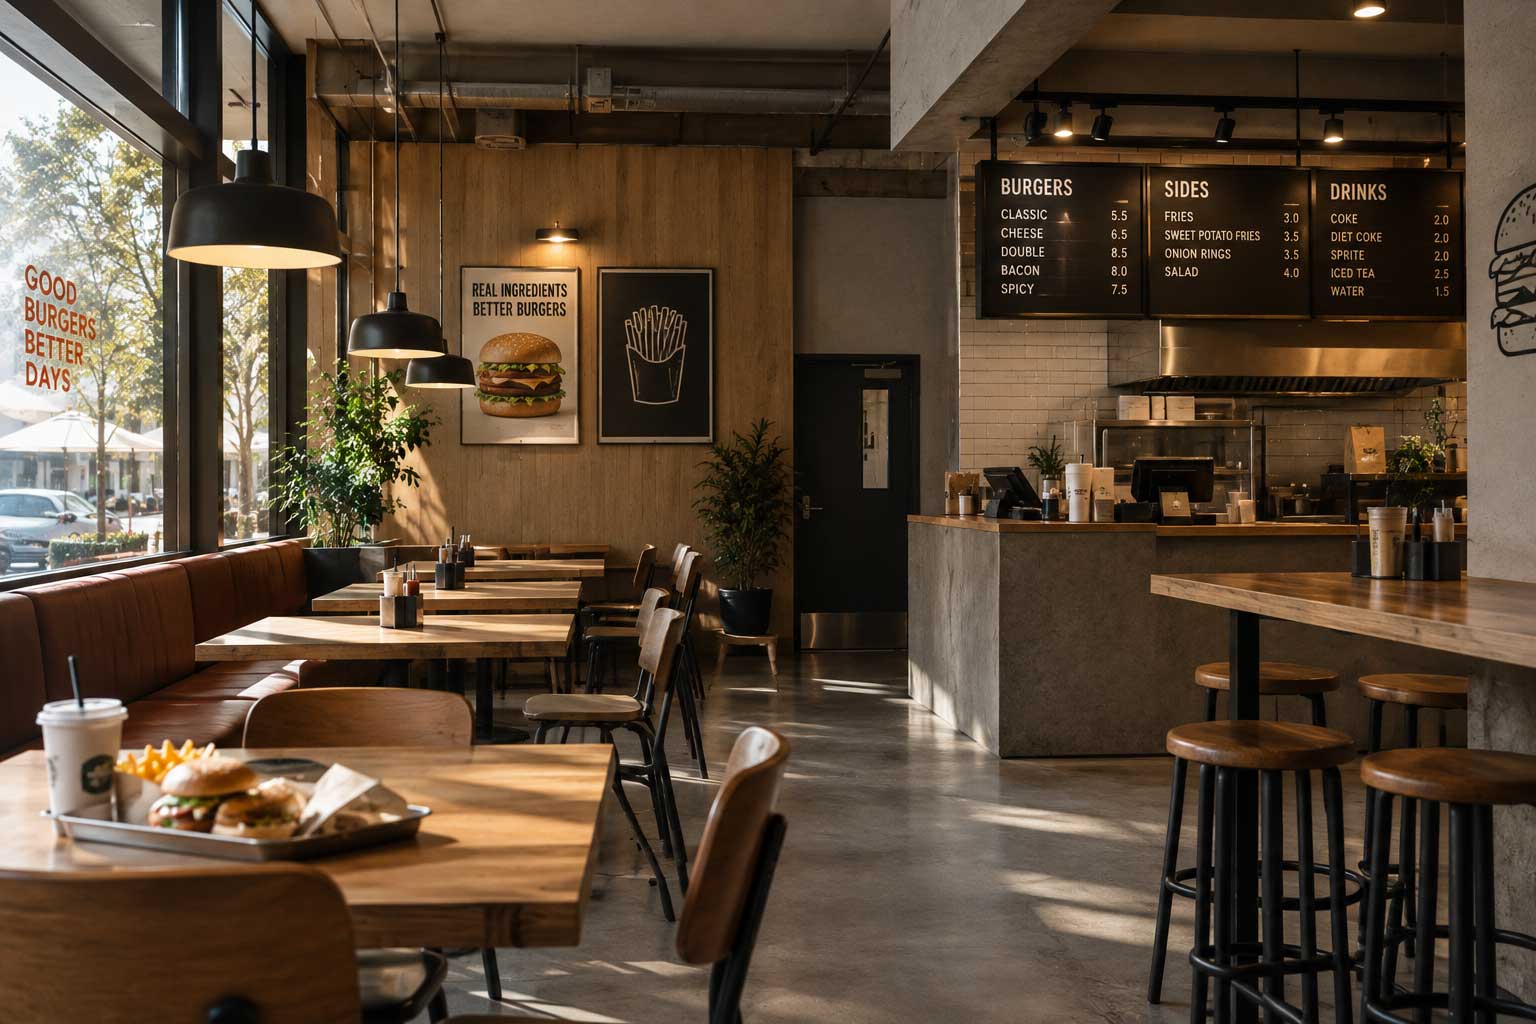
The Sizzler rebrand and remodel with Tavern Agency is the cleanest recent case. Chief Growth Officer Robert Clark told QSR Magazine that updated restaurants averaged a 47% sales lift. The Fresno location was up 22.2%. Visalia was up 43.8%. Guest counts moved in step with the sales, which rules out the "you just raised prices" version of the story.
Applebee's Lookin' Good programme at Dine Brands has been running long enough to show results from individual franchise owners. Renovated stores are hitting sales lifts of 5 to 15%. About three-quarters of the system has chosen to speed up its remodels. Nine of Applebee's top ten franchisees are inside the programme. That last number matters, because how much of their own money the franchise owners are willing to put in is what most public restaurant CFOs actually watch as an early sign that this kind of investment works.
Burger King's Reclaim the Flame is a $400 million commitment that Restaurant Brands International announced in 2022. It has funded around 800 remodels under the Royal Reset design. Previous Burger King remodel programmes produced roughly 12% first-year sales uplifts. A batch of 50 stores from the newer programme, open for at least six months, delivered a 20% lift. That is closer to the Sizzler size of change, and it reflects heavier work on each store.
The pattern holds up across brands. Casual dining chains that put together a clean before-and-after design change, and then follow it with a disciplined operational rollout, produce double-digit sales lifts. The variance sits in scope, in market density, and in whether the operations team kept the standard up after the general contractor left. This kind of measurement has been around for years.
Where the numbers get slippery
The biggest honest problem is figuring out what actually caused what. A renovation almost never lands on its own. It arrives with new photography. It arrives with refreshed positioning. It arrives with an updated rate strategy. Sometimes there is a new general manager spending capital, because the owner has just handed them a mandate. If you want to know
exactly how much of the lift came from the design alone, you need a control property, or a strict comp-set discipline. Most owners don't fund either.
Sample size is the second problem. A single-property lift of 43.8% is a real data point, but it is a data point with a lot of noise around it. Portfolio programmes like Lookin' Good produce more reliable ranges because the noise from any one property gets averaged out over hundreds of stores.
The Emerald study's polite name for the third problem is hedonic adaptation. The plain version is that guests get used to the new lobby within six to twelve months, and the review-score bump collapses if operations don't hold the standard up. Any renovation ROI model that assumes the year-one lift continues forever will be wrong by the second year.
There is also a segmentation issue underneath all this. Sustainability, cleanliness and digital keys have moved into the category of basic expectations for most segments. They don't lift a score above the average. But if any of them are missing, the score sinks below the average. If you want design to lift a score, and not just to keep it from sinking, the design has to move into ground your competitors are not already covering.
The set of steps for owners who want to end the argument is short. Name the number in the design brief. Take a baseline reading before demo. Take the reading again at 12 months after the reopening, and again at 24 months. Compare each reading against the comp set. If a design programme can't tell you which of RevPAR, RevPASH, NAGSI dimensional score or Google composite it has agreed to move, then the sceptic who called design "just a feeling" was right about your project, even if they were wrong about the discipline.
Interior design in hospitality has been measurable for years. The reason it still gets called unmeasurable is that it usually enters a project with no number attached to it, and it usually leaves without a clear read on what it changed. That is a management problem in how hospitality projects get set up.